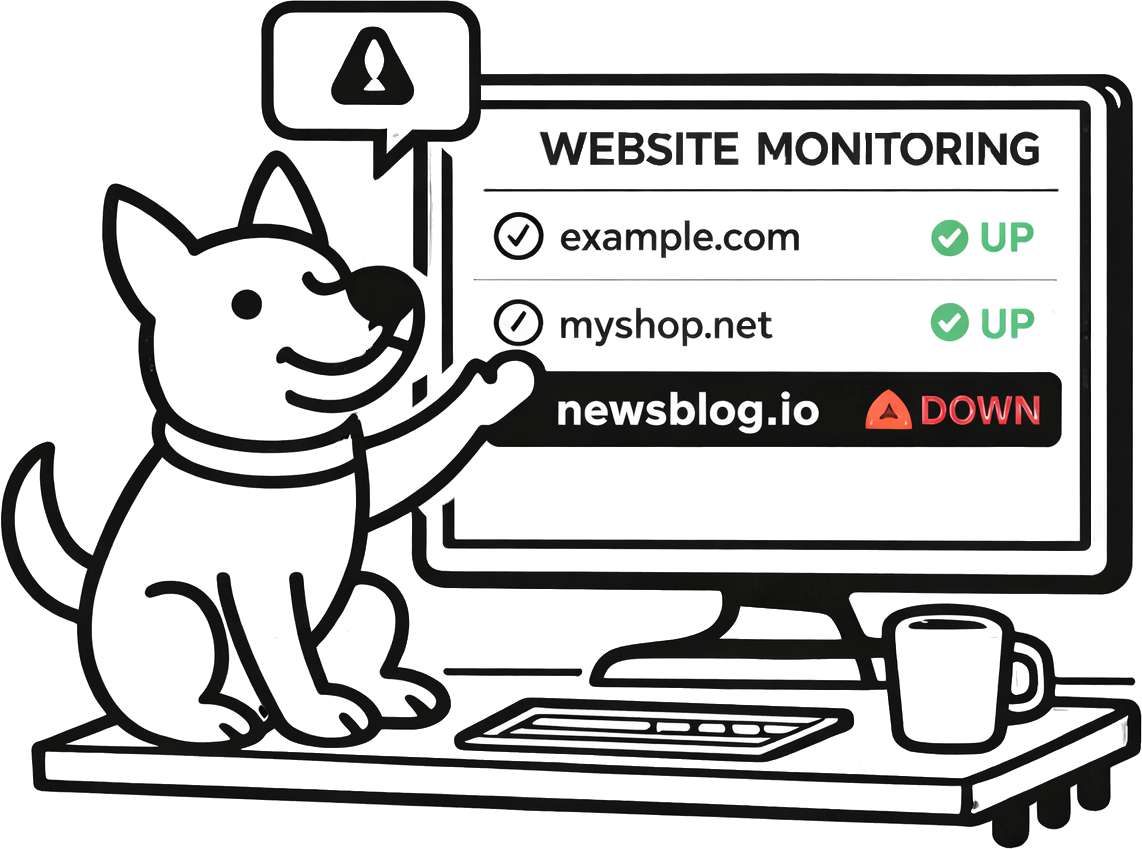
Webhook endpoint monitoring
When a webhook receiver breaks, the rest of your system breaks downstream—payments don’t reconcile, automations stop, and customer data drifts. UpDog helps you monitor webhook receivers like any other critical endpoint: uptime, latency, and “is it returning the right thing?”

What you can do with UpDog for webhook failure alerts
“Webhook monitoring” can mean a few things. UpDog focuses on the parts you control and can act on quickly: your receiver endpoint and your processing pipeline.
- Monitor the receiver endpoint (reachable, correct status codes, predictable response).
- Monitor receiver latency so you catch slowdowns before providers start retrying.
- Monitor content changes with keyword monitoring (maintenance page, auth error, unexpected HTML).
- Monitor processing pipelines with heartbeat checks if you have scheduled jobs that process webhook events.
How to set it up (step-by-step)
- Identify an endpoint you can safely monitor:
- Your webhook receiver URL (only if it can respond predictably to GET/HEAD), or
- A dedicated health endpoint for the webhook service (recommended).
- Create a website monitor in UpDog for the endpoint and pick an interval.
- Optionally add keyword monitoring to detect unexpected pages (for example: “maintenance”, “forbidden”, “error”).
- If you process webhooks asynchronously, add a heartbeat monitor to the scheduled job that drains/processes the queue.
- Route alerts to the right channel: email baseline, chat for coordination, on-call/SMS for critical receivers.
Best practices
Prefer a health endpoint
Many webhook receivers only accept POSTs and may reject GET requests. A lightweight health URL for the receiver service makes monitoring more reliable and less intrusive.
Monitor the “right failure”
A receiver can return 200 but still be broken (wrong environment, wrong secret, wrong routing). Use keyword monitoring to detect unexpected content and consider monitoring a downstream health check if you have one.
Keep alert routes tight
Webhook receivers are often critical. Route them to responders with a clear escalation path, but avoid paging for non-prod endpoints.
Troubleshooting
- Monitoring the receiver causes 405/403: use a health endpoint instead of the raw webhook URL.
- Unexpected content alerts: check WAF/bot protection or a misconfigured reverse proxy returning HTML instead of your service.
- Latency alerts: investigate DB latency, queue backlog, and third-party dependencies used during signature verification.
- Provider retries but UpDog shows green: the receiver might be reachable but rejecting requests (auth/signature). Add provider-side dashboards and internal metrics for deeper visibility.
FAQ
What is webhook endpoint monitoring?
Monitoring the HTTP endpoint that receives webhooks for uptime, latency, and correct responses.
How do I get webhook failure alerts?
Monitor the receiver/health endpoint with HTTP checks, add keyword monitoring for error content, and add a heartbeat monitor for the processing job if applicable.
Can UpDog monitor third-party webhook delivery attempts?
UpDog monitors your endpoints and jobs. Use provider dashboards for delivery-specific details and pair them with UpDog for early alerting.
What should I alert on for webhook receivers?
Non-2xx/timeouts, latency spikes, and unexpected content.
How do I avoid false positives for webhook monitoring?
Monitor a stable health URL and avoid endpoints that require complex auth or change content frequently.
Related features
- Website monitoring
- Keyword monitoring
- Cron / heartbeat monitoring
- Webhook uptime alerts (outgoing)
- Pricing
Related use cases
- Heartbeat monitoring – Monitor webhook processing jobs
- Out-of-stock alerts – E-commerce content monitoring
- All use cases
Make webhooks boring again
Monitor your receivers and get alerted before downstream systems drift.