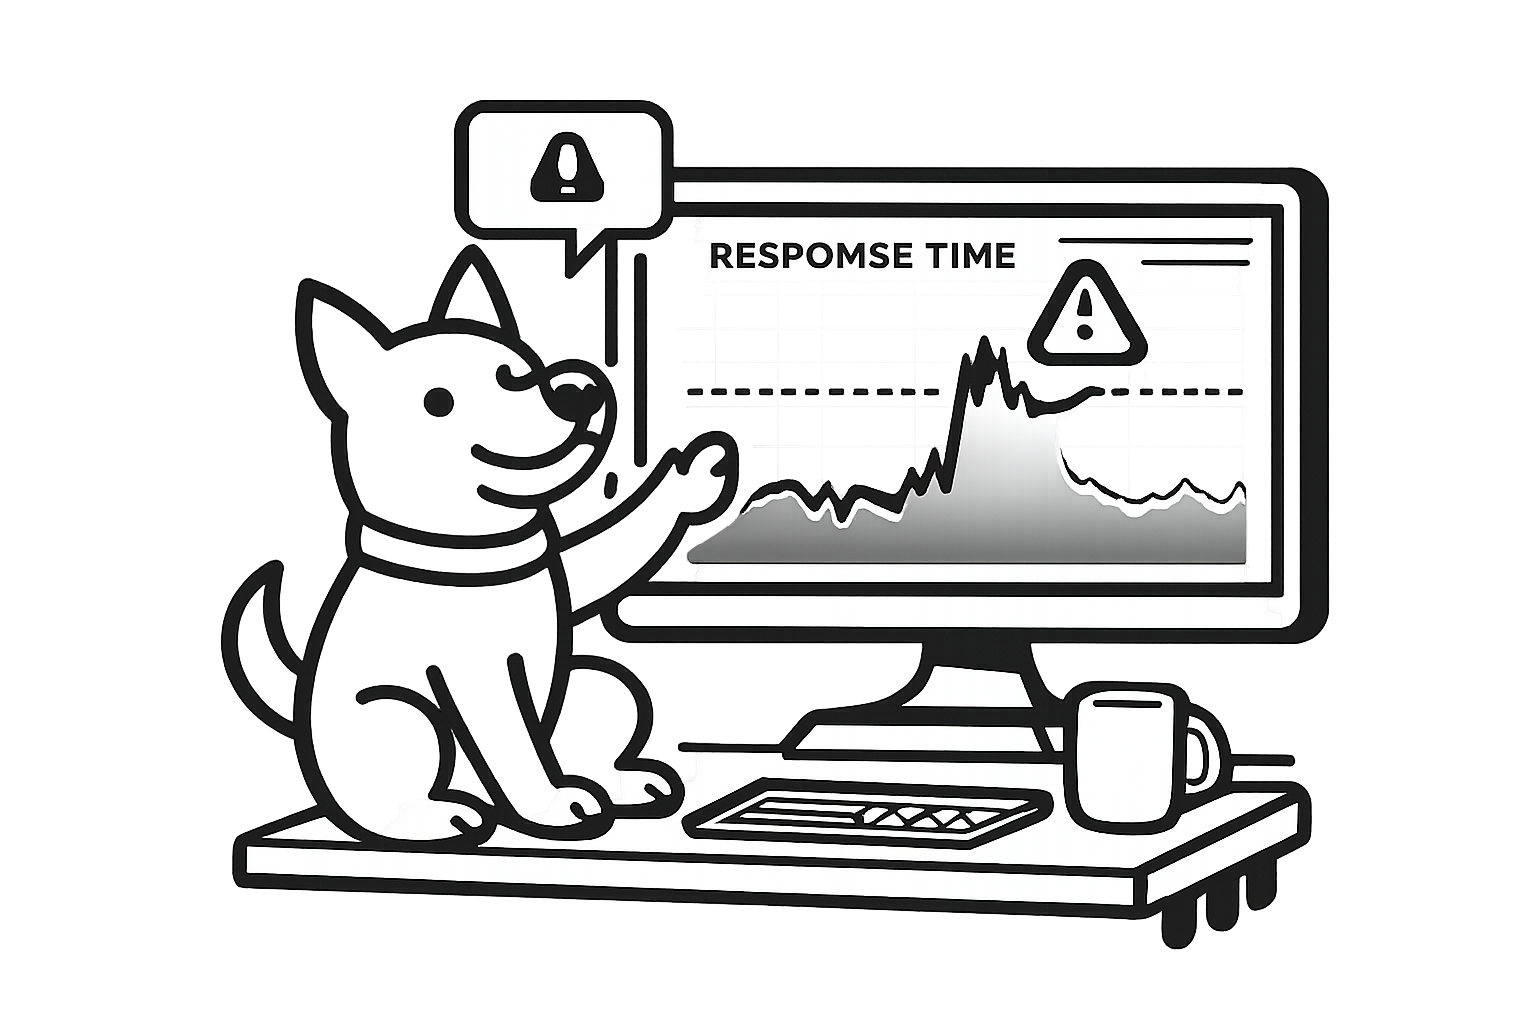
Response Time Monitoring & Latency Alerts
Uptime isn’t enough—slow feels “down.” UpDog tracks response time over time and sends alerts on slowdowns and latency spikes, so you can fix performance regressions before users bounce.

What is response time monitoring?
Response time monitoring measures how long it takes for your site or API endpoint to respond to a request—then tracks that latency over time. It turns “it feels slow” into a chart and a threshold you can actually alert on.
It matters because performance is part of reliability: slow pages hurt conversion and user experience, slow APIs break integrations, and increasing latency is often the first signal of an incident (long before you see a hard outage). It’s also a practical way to validate SLAs/SLOs with real data.
What UpDog measures
UpDog runs HTTP checks on a schedule and records the result over time. At a minimum, that includes the endpoint’s HTTP status code and the total request/response latency.
Teams typically monitor the endpoints that map to real user impact:
- Homepage and key landing pages
- Login and session endpoints
- Checkout and payment flows
- API endpoints used by customers, mobile apps, or partners
If you want a clean signal, consider monitoring a dedicated health endpoint alongside the “real path” URLs. That gives you both: “is the system alive?” and “is the experience fast?”
Catch slowdowns before they become outages
Most outages start as degradation. Response time monitoring helps you catch the early warning signs:
- DB contention / slow queries: a steady climb in latency as the database fights for locks or a query plan regresses.
- Third-party dependency lag: payments, auth, analytics, or email providers slowing down and dragging requests with them.
- Deploy regressions: a release that adds a new hot path, heavier payloads, or a missing cache.
- Resource saturation: CPU, memory, or connection pools hitting a limit and creating queues.
- Queue buildup: background work backing up until the front-end requests start waiting.
Set thresholds that match reality
Alerting on “any slow check” gets noisy fast. A more reliable pattern is: alert when response time exceeds X ms for Y minutes. That catches sustained degradation while filtering temporary blips.
Practical starting points: many teams begin with 500ms for critical pages and 1000ms for heavier endpoints, then tighten or loosen based on what “normal” looks like for that specific URL. Your best thresholds come from your own history.
See trends, not just spikes
Spikes happen. What you care about is whether latency is drifting upward over hours, days, or after a deploy. UpDog keeps response time history so you can see trends, compare periods, and quickly answer: “when did this start?”
Use the chart to correlate slow periods with releases, incidents, traffic changes, or upstream provider events. Even without complex stats, a clear timeline makes debugging faster.
Alerts where you already work
Email and SMS are first-class alert channels in UpDog. Use them for simple coverage, or as a reliable “this will wake me up” backup.
If your team runs incidents in chat and on-call tools, you can also route response time alerts to your existing workflow via integrations.
How to set up response time monitoring
- Add a URL (website or API endpoint).
- Choose a check schedule + threshold that matches the endpoint.
- Pick alert channels (email, SMS, and/or integrations).
FAQ
Related features
Round out response time monitoring with the rest of your reliability coverage:
- Uptime & website monitoring for outages and status checks.
- SSL certificate monitoring for expiry alerts before browsers block users.
- DNS monitoring to catch record changes that can reroute traffic.
- Status pages to share uptime and incidents with customers.
- Alert integrations to route notifications into your workflow.
Start catching latency issues early
Add a URL, set a threshold, and get alerted when response time climbs. It takes a minute—and it pays off the first time a “slow” incident hits.