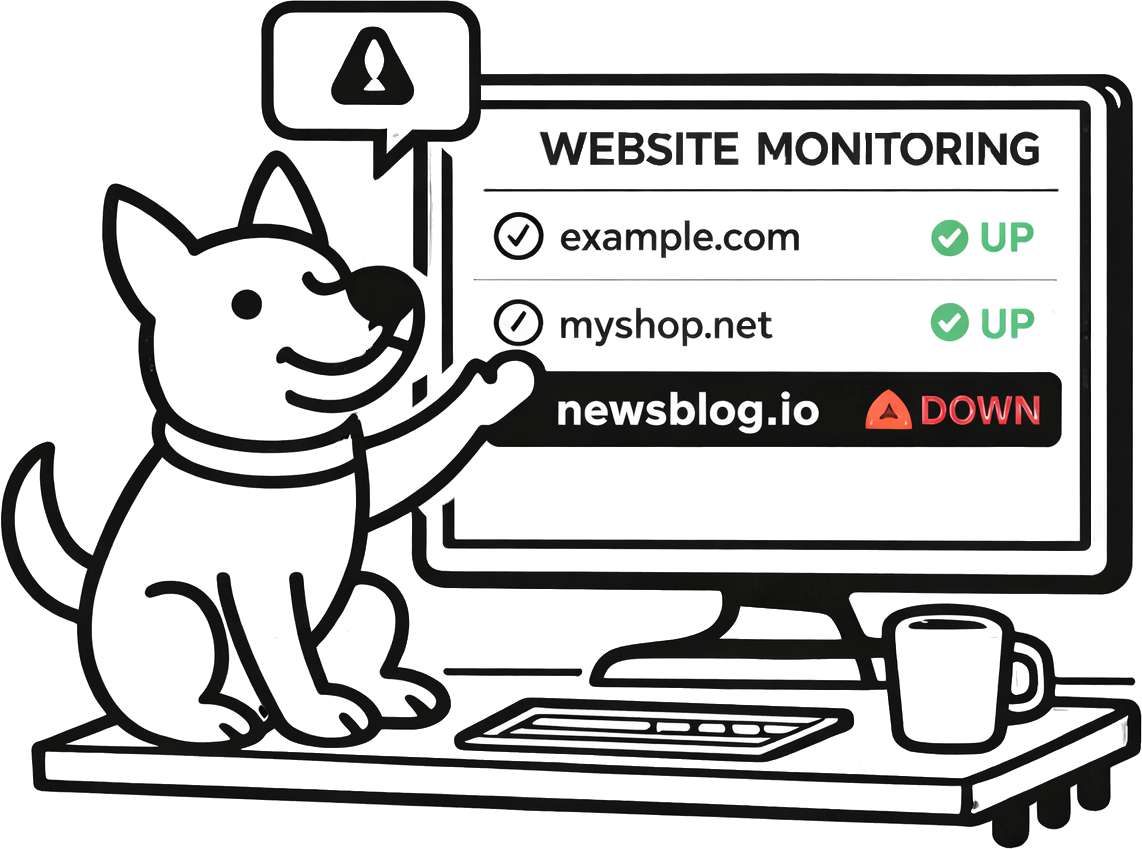
Website Monitoring & Uptime Alerts
Know the moment your site goes down—and the moment it comes back. UpDog checks your URLs on a schedule, tracks response time, and sends downtime notifications fast via email and SMS.
Keep it simple: one monitor per critical URL, alerts your team will actually see, and a clean timeline you can use during incident review.
Fast detection
Website monitoring is only useful if it’s quick. Run scheduled checks so you find out about downtime before users do.
Uptime alerts (down + recovery)
Get downtime notifications by email and SMS, and route events into your workflow via integrations.
Response time history
See whether issues are hard outages or slow degradation. Pair this page with response time monitoring when performance is a reliability requirement.
What is website monitoring?
Website monitoring is a scheduled check that confirms a URL is reachable and responding as expected. In practice, that usually means making an HTTP/HTTPS request and verifying you got a valid response.
It’s not just “is the server up?”—it’s “can users load the site?” That’s why website monitoring is different from low-level reachability checks like ping monitoring: HTTP tells you about your app and web layer, not only the network path.
What UpDog checks
For website monitoring, UpDog makes an HTTP/HTTPS request to the URL you provide and records the result over time. That gives you a clean signal you can alert on and a history you can use when debugging.
- HTTP(S) request succeeds: a response is returned within the timeout window.
- Status code outcome: UpDog treats 2xx/3xx as “up” and 4xx/5xx as “down”. Redirects are followed, so the final response is what’s evaluated.
- Response time tracking: each check records how long the request took, so you can separate “down” from “slow.” See response time monitoring for deeper performance workflows.
- Content verification (optional): if you need to confirm a page contains a specific phrase (or that a banner disappeared), use keyword monitoring.
Common failure modes are straightforward: timeouts, DNS resolution issues, connection errors, and unexpected status codes (like 404/500). UpDog turns those into clear up/down state changes so you can act quickly.
Simple failure types (so you can debug faster)
- Timeout: the URL didn’t respond in time (often overload, upstream slowness, or routing trouble).
- DNS resolution failure: hostname couldn’t be resolved (record changes and propagation can contribute to downtime).
- Connection error: request couldn’t connect (network issue, firewall change, service down).
- Non-expected status: a 4xx/5xx response (app error, missing route, deploy regression).
Why uptime monitoring matters
- Catch outages before customers: learn about problems from alerts, not support tickets.
- Protect revenue and conversions: downtime and errors kill signups, checkouts, and retention.
- Detect broken deployments: a “successful” deploy can still ship a 500/404 to production.
- Spot external changes that contribute to downtime: DNS updates, routing changes, and expired domains can all break availability.
- Reduce MTTR: faster detection means faster triage and faster recovery.
- Build confidence: when you can answer “when did this start?”, incidents are less chaotic.
Set alerts your team will actually see
Alerts only work if they land in the right place. UpDog supports email and SMS for downtime and recovery notifications—good defaults that work everywhere.
If your team triages incidents elsewhere, you can also route events via alerts and integrations (for example, chat, on-call workflows, and custom automation via webhooks). Keep the routing simple: send high-urgency monitors to the channels that wake someone up, and keep the rest in email.
A practical alert rule
Alert on down + recovery. Down tells you to act. Recovery tells you when the blast radius is over (and gives you a clean “incident duration” without manual note-taking).
Reduce false alarms
False alarms come from flaky networks, bot-blocking, and endpoints that aren’t stable. UpDog keeps the model honest: a website check is an HTTP request, so if it fails, that’s the signal.
- Use stable URLs: monitor an intentionally “monitor-friendly” endpoint (like
/health) alongside a real user-facing path. - Choose sensible schedules: shorter intervals find outages sooner, but they also surface short blips. Pick the smallest interval you can respond to.
- Keep timeouts realistic: if an endpoint sometimes takes several seconds, a too-aggressive timeout can create noise.
- Pair signals: use ping monitoring (reachability), port monitoring (service open/closed), and SSL monitoring (certificate health) to distinguish “app down” from “network weird.”
How to set up website monitoring
- Add a URL you want to monitor (website or API endpoint).
- Choose a check schedule (and keep timeouts practical for that endpoint).
- Pick alert channels and recipients so the right people get notified on down + recovery.
Tip: name monitors like you debug
Use names that answer “what’s broken?” quickly: example.com (homepage), api.example.com (/health), checkout (/create-session). During an incident, clarity beats clever naming.
Best practices
- Monitor key user paths: homepage, login, checkout, and one “golden path” API endpoint.
- Pair website checks with supporting monitors: DNS monitoring, SSL monitoring, port monitoring, and ping monitoring help you pinpoint the failure layer faster.
- Publish transparency when it matters: if you have a customer-facing product, consider a status page to reduce support load during incidents.
FAQ
/health endpoint for a clean “service alive” signal, and also monitor one real user-facing endpoint to catch app-level regressions.Related features
Website monitoring is strongest when paired with other signals. Related UpDog pages:
- Response time monitoring to catch slowdowns before users bounce
- Ping monitoring for network reachability signal
- Port monitoring to verify services are listening and reachable
- DNS monitoring to track record changes that can break routing
- SSL monitoring to avoid certificate expiry incidents
- Keyword monitoring for “up but wrong” content checks
- Status pages for customer-facing incident transparency
- Alerts and integrations to route events into your workflow
Ready to stop refreshing your site?
Create a website monitor in minutes. Start with one critical URL, add a health endpoint, and route alerts to email + SMS so you don’t miss downtime.
Start Monitoring for Free