
How to Set Up Uptime Monitoring for Your SaaS in 15 Minutes (Without Managing Servers)
Uptime is part of the product for any SaaS. In this guide, you’ll set up an external uptime monitor, basic alerts, and a simple status page in about 15 minutes using a hosted tool, so you don’t have to maintain extra infrastructure.
Why External Uptime Monitoring Matters
When your product is down, users usually notice before you do. Even short outages can create support tickets, refunds, and churn if they happen at the wrong time.
Monitoring from inside your own stack is useful, but it has a limitation: if your infrastructure is having problems, your internal checks might be impacted too. An external monitor checks your app from the outside and alerts you when something is unavailable or slow.
What You Need Before You Start
You don’t need a DevOps background to follow this. You just need:
- A live URL for your SaaS (production or staging).
- An email address you actually check (for alerts).
- Optional: a domain you want to use for a public status page.
This walkthrough uses UpDog as the hosted uptime and status monitoring tool, but the structure is similar in most hosted monitoring platforms.
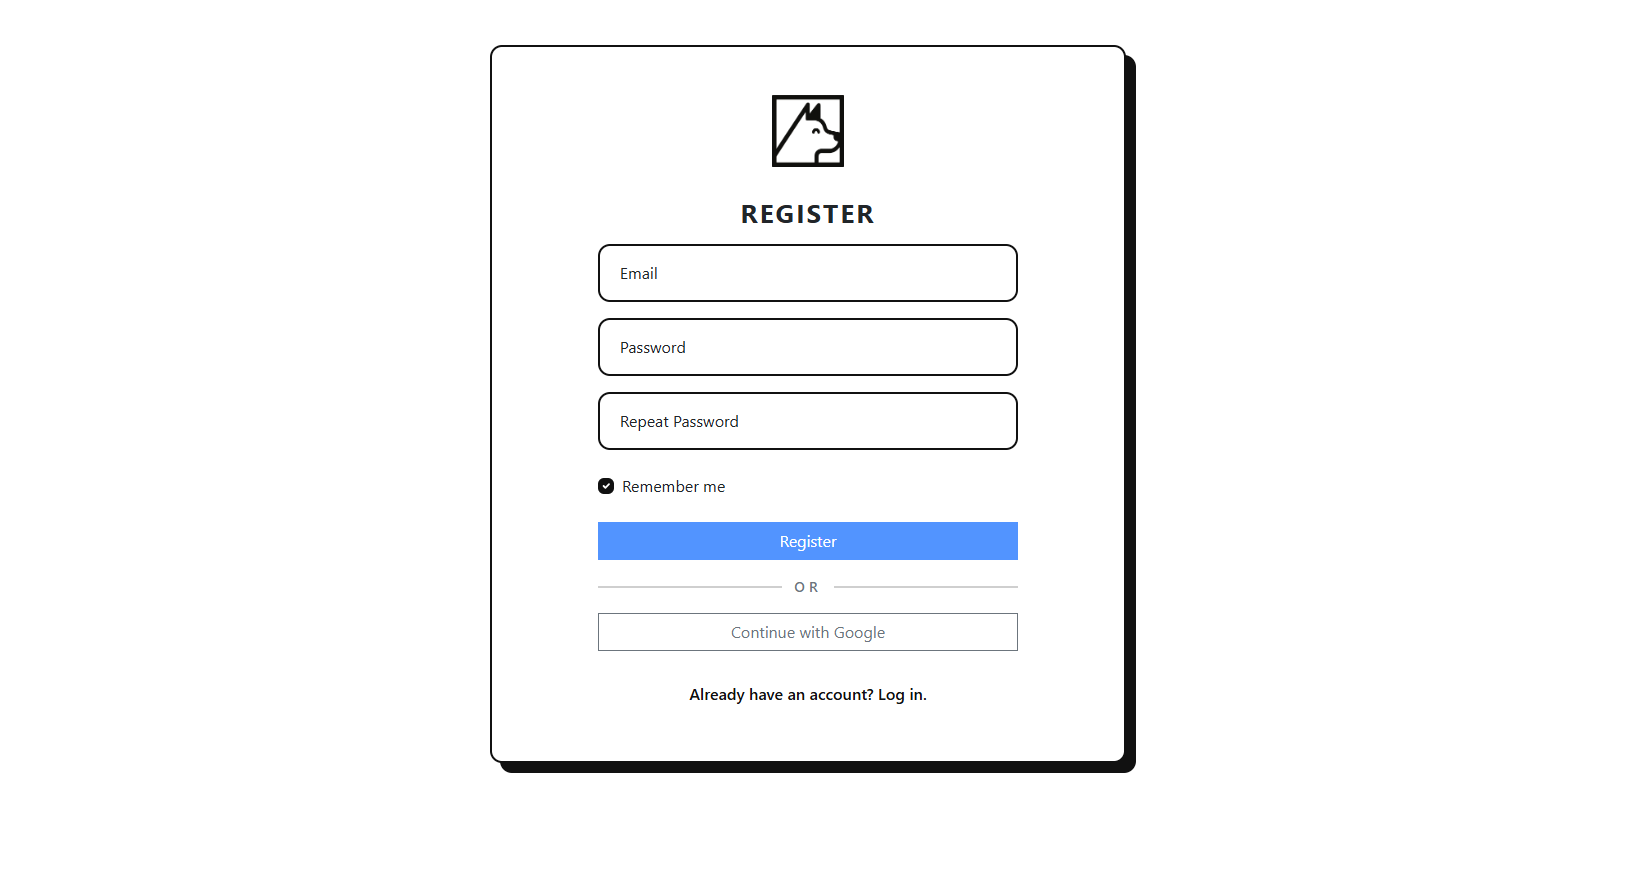
Step 1: Sign In to UpDog (Org Created for You)
Start by signing in to UpDog. You can authenticate with a standard username and password, or use the Google OAuth flow if you prefer to log in with your Google account.
On first sign-in, UpDog automatically creates an organization for you. There’s no extra setup step — you land in an org that’s ready for monitors, and you can adjust the name or invite teammates later.
Step 2: Add Your First Uptime Monitor
Next, add an HTTP(s) monitor for your main application endpoint. This is usually your app’s primary URL or a dedicated health-check endpoint that reflects core dependencies.
Recommended starting settings
- Type: HTTP(s) monitor
- URL: Your main app URL (e.g.,
https://app.yoursaas.com) - Interval: 1–5 minutes, depending on how quickly you want to be notified
- Retries: 2–3 retries before marking it as down
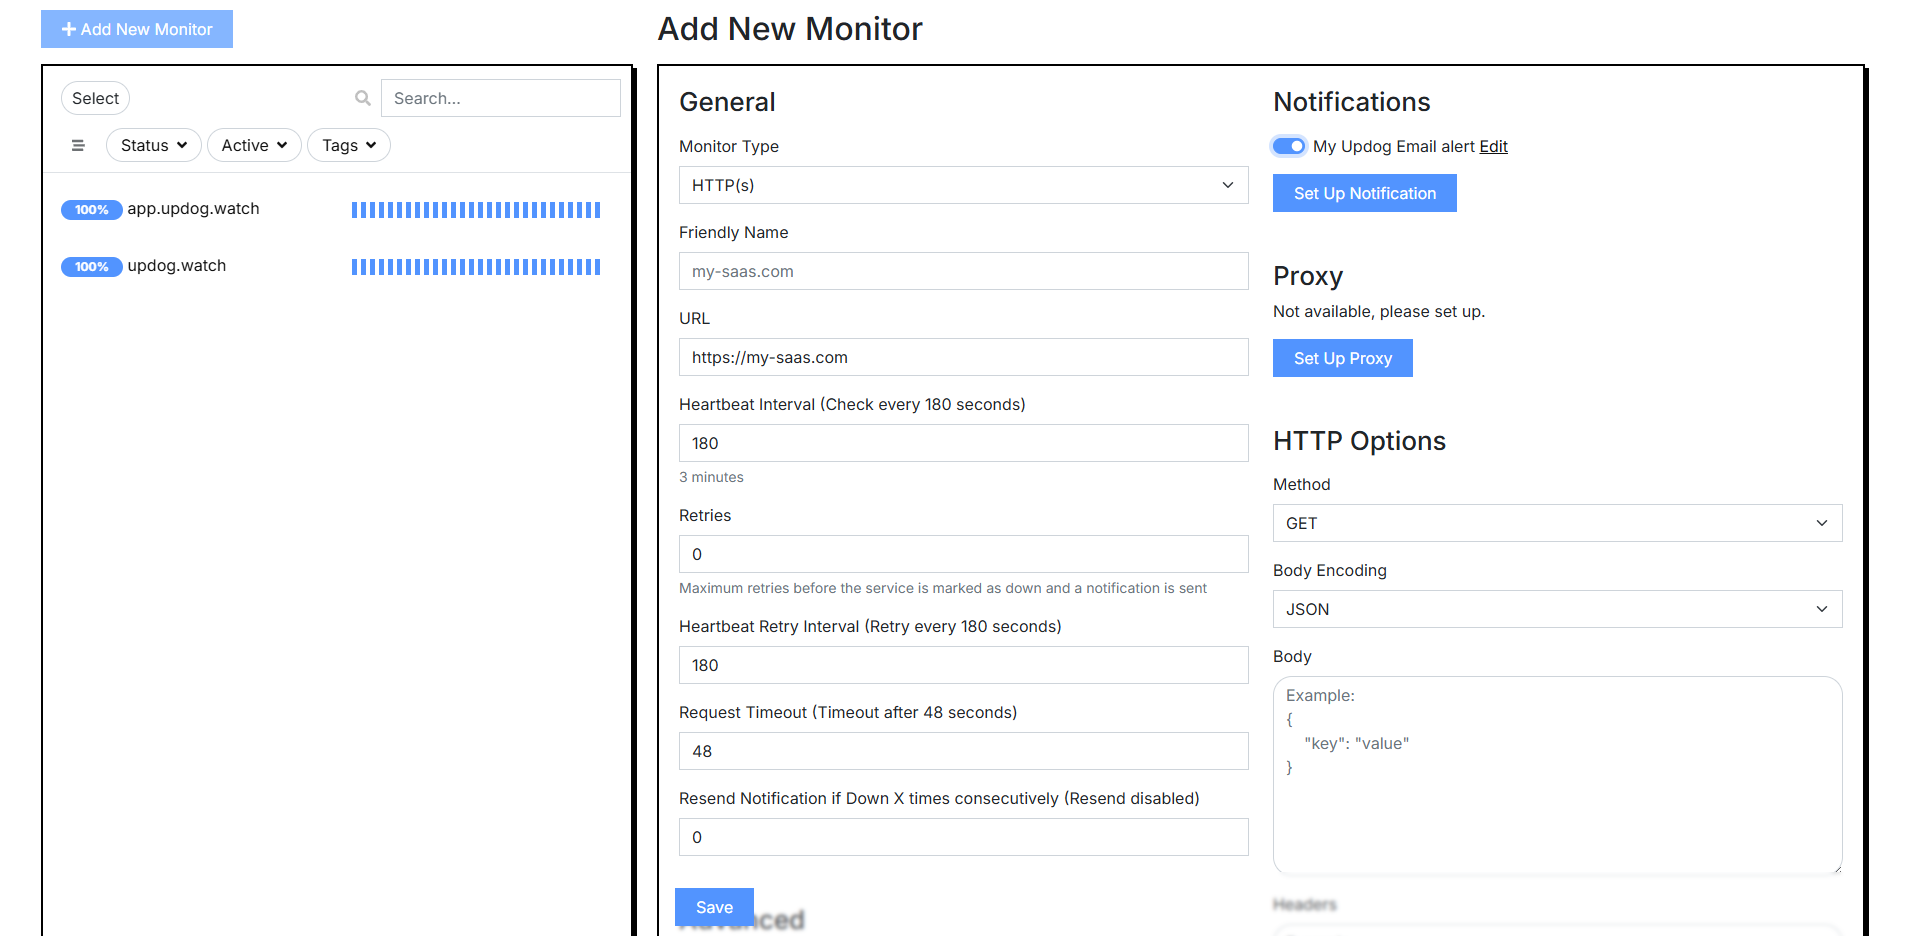
After you save the monitor, UpDog will start checking your app automatically and recording response times and status codes.
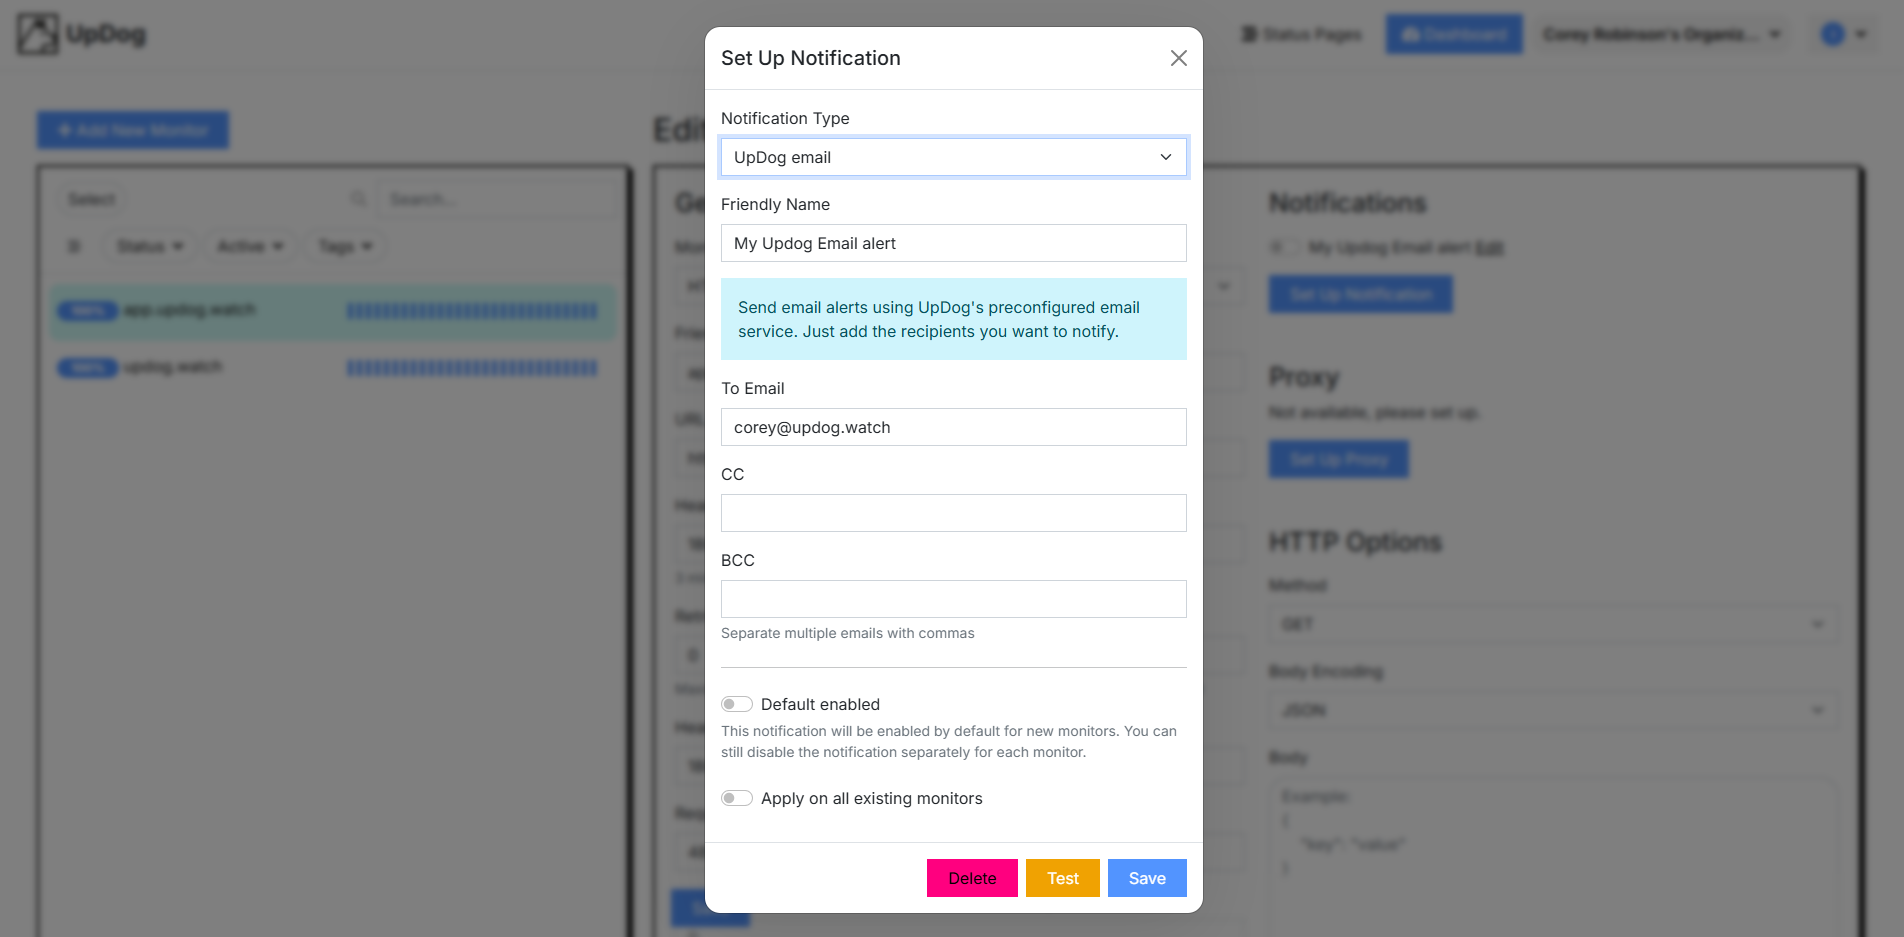
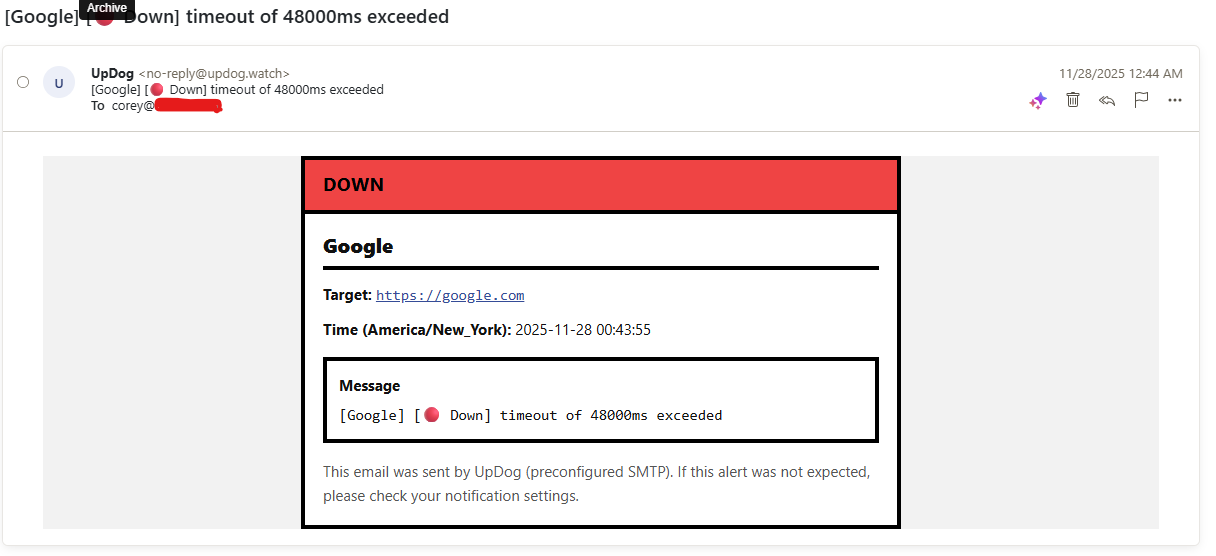
Step 3: Configure Alerts
Monitoring is only useful if someone is notified when there’s a problem. In UpDog, you can send alerts to email, chat tools, or other channels depending on your setup.
Set at least one primary channel
- For solo founders: Use your main email address and consider a personal Slack or similar channel.
- For teams: Send alerts to a shared incident or on-call channel so more than one person sees them.
Step 4: Create a Simple Status Page
A status page turns your monitoring data into something your users can understand. Instead of asking “is it just me?” they can quickly see current service health and any active incidents.
In UpDog, you can create a status page, choose which monitors to show, and optionally connect it to a custom domain
such as status.yoursaas.com.
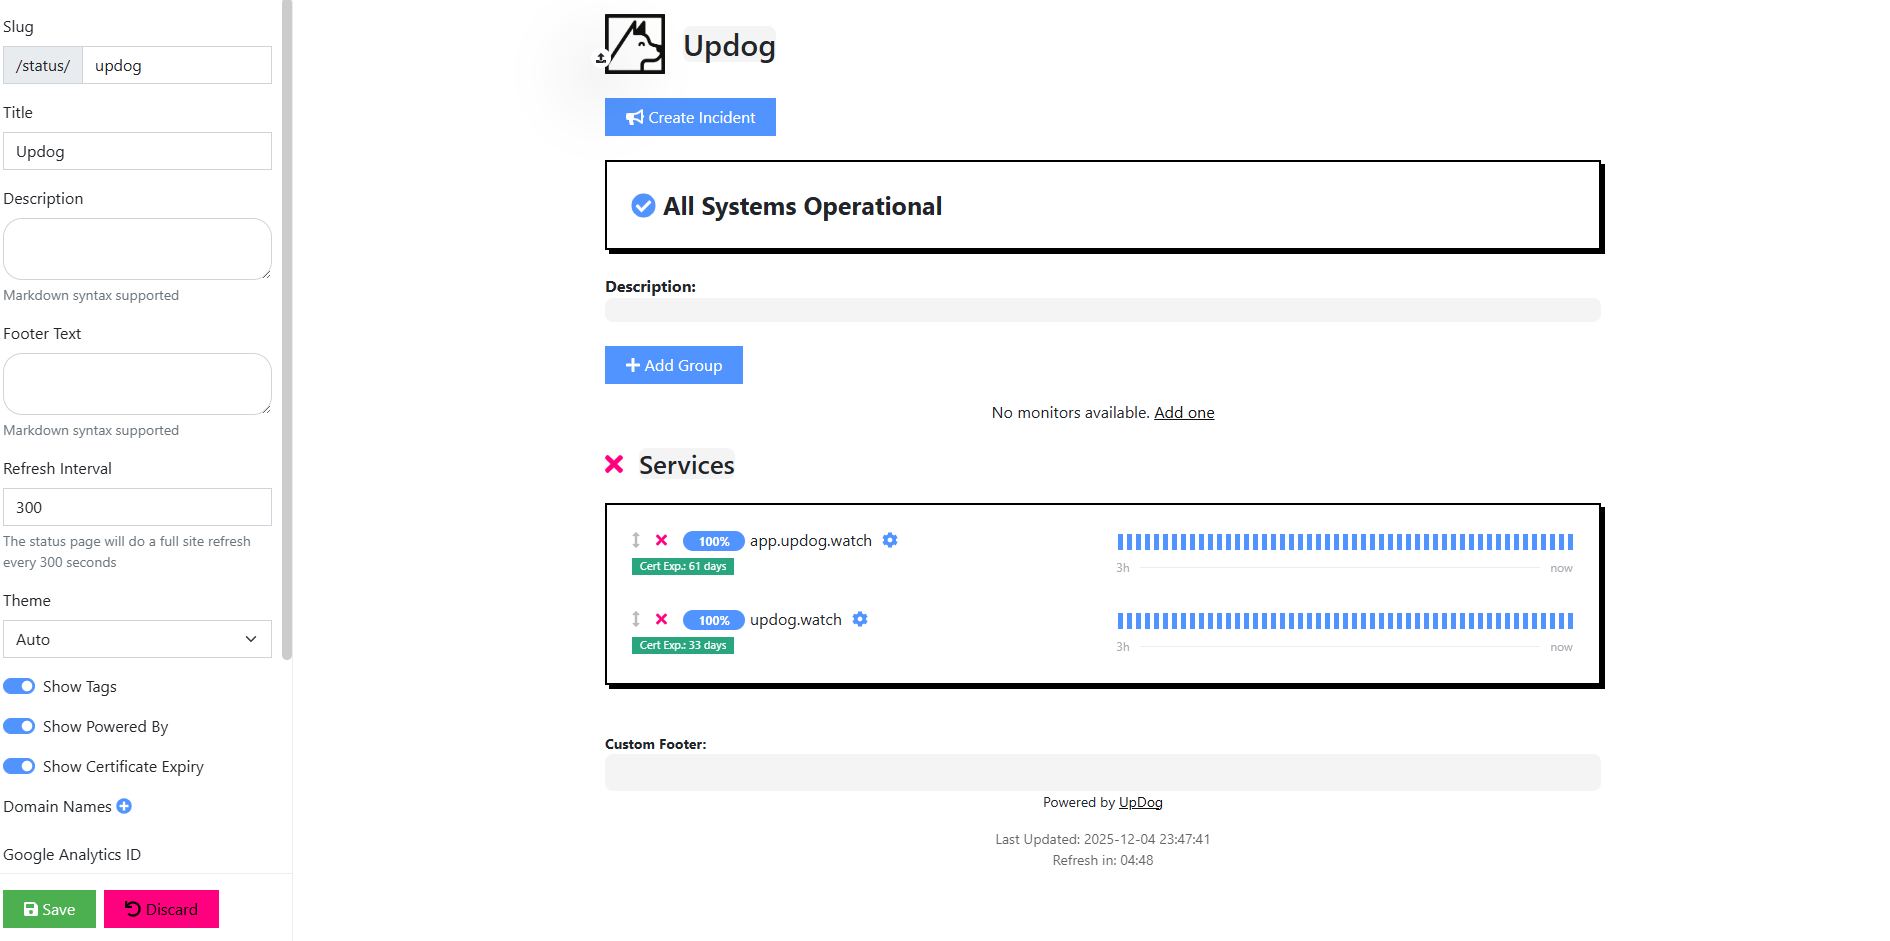
What to show on your status page
- Your main application and API endpoints.
- Critical background services (billing, email processing, etc.).
- Clear, concise incident updates when issues occur.
Step 5: Test Your Setup
Before you rely on this in production, run a quick test to confirm that everything behaves as expected:
- The monitor correctly detects an outage.
- Alerts reach the right people or channels.
- The status page reflects the change in state.
You can test by temporarily pointing the monitor at an invalid path, blocking access in a controlled environment, or briefly disabling a dependency you can safely turn off.
Best Practices as You Grow
Once the basics are in place, you can expand your monitoring to cover more of your system without making it overly complex.
- Monitor both the public app and key API endpoints.
- Use shorter intervals for high-impact paths and longer ones for low-priority checks.
- Add monitors for scheduled jobs and background workers that must run reliably.
- Review alert recipients regularly so the right people are notified.
You don’t need to start with dozens of monitors. Cover the core user paths first, then add more checks as your product and team mature.
Get Basic Monitoring in Place Today
With a login, a handful of monitors, alerts, and a status page, you get a clear view of whether your SaaS is up and how it’s behaving from the outside.
If you want a hosted option without managing extra infrastructure, you can set this up in UpDog at updog.watch.